8 Code Optimization
openstatsware Workshop: Good Software Engineering Practice for R Packages
April 18, 2024
Acknowledgments
This section is adapted from slides by Lukas A. Widmer and Michael Mayer, which they prepared and released under the CC BY 4.0 license, see their course Go fastR – how to make R code fast(er) and run it on high performance compute (HPC) clusters.
Thanks a lot Lukas and Michael!
Introduction
A Word of Wisdom
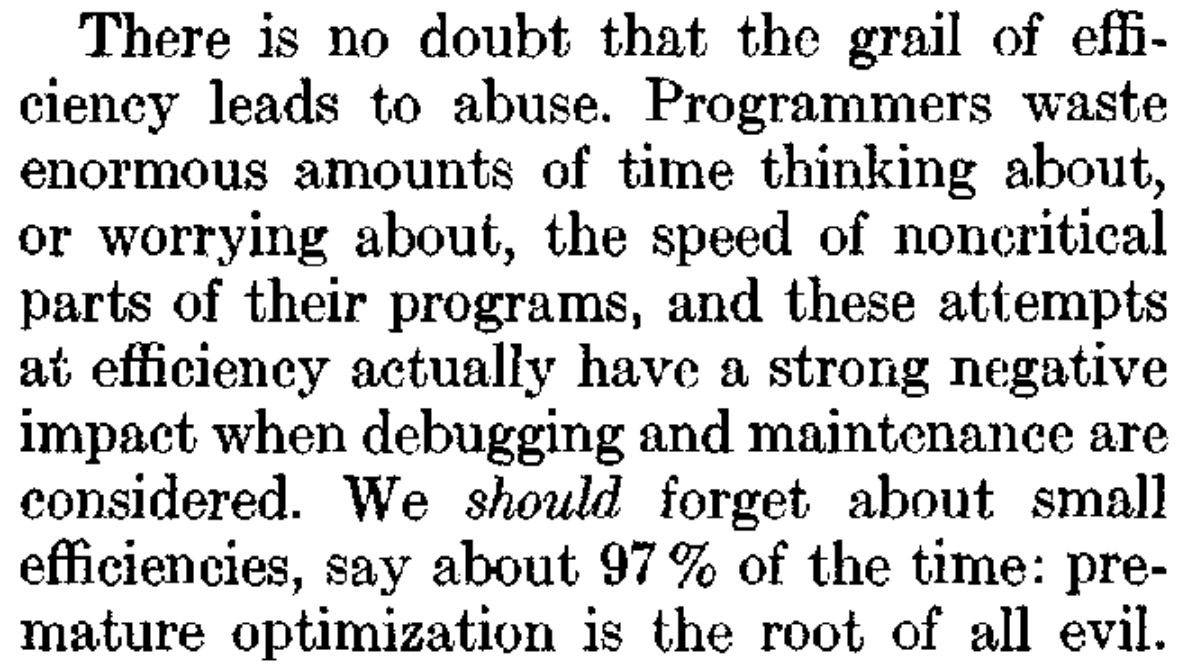
Setting the right priorities
- The code needs to be correct, i.e. calculate correct results as expected. → Tests, Debugging
- If it is correct, but too slow, then find out which calculations and why they are too slow. → Profiling
- Once you identified the slow parts, optimize those. → Code optimization
- If executing the code on your laptop is still too slow → consider running it instead on a high performance cluster (HPC), see slides from Lukas and Michael
Tests: see previous section
Debugging: A few pointers
- Post-hoc
traceback()after code fails, to show the call stack and see how the error came about. - Setting
debug(myfun)for the problematic functionmyfunand then run the code to step through its execution. - Inject
browser()calls into problematic code to add “breakpoints” for interactive execution and inspection. - Setting
options(error = recover)and then running the problematic code allows you to jump into the call stack and inspect. (Undo withoptions(error = NULL))
Debugging: Some RStudio specifics
Let’s have a look at RStudio IDE specific details.
- The “Debug” menu can be useful to explore the options.
- Editor breakpoints: Can add with click to the left of line number and gives “red dot”.
- Click on “Source” to run the script and enter debug mode.
- “Debug” > “On Error” > “Break in Code” again lets you jump into the code on error.
- Debugging in Rmarkdown documents can be tricky, either proceed chunk by chunk, or try
sink()
See Posit website for details.
Profiling
Profiling: Definition
In software engineering, profiling (“program profiling”, “software profiling”) is a form of dynamic program analysis that measures, for example, the space (memory) or time complexity of a program, the usage of particular instructions, or the frequency and duration of function calls. Most commonly, profiling information serves to aid program optimization, and more specifically, performance engineering.
Profiling: Example code
Profiling: Let’s identify the bottlenecks!
In R there are a couple of basic functions for profiling:
system.time()Rprof:- start with
Rprof() - execute the code
- stop with
Rprof(NULL) - summarize with
summaryRprof()
- start with
See e.g. Peng (2016), chapter 19, for details.
Profiling: Classic Rprof output
Profiling: Getting visual
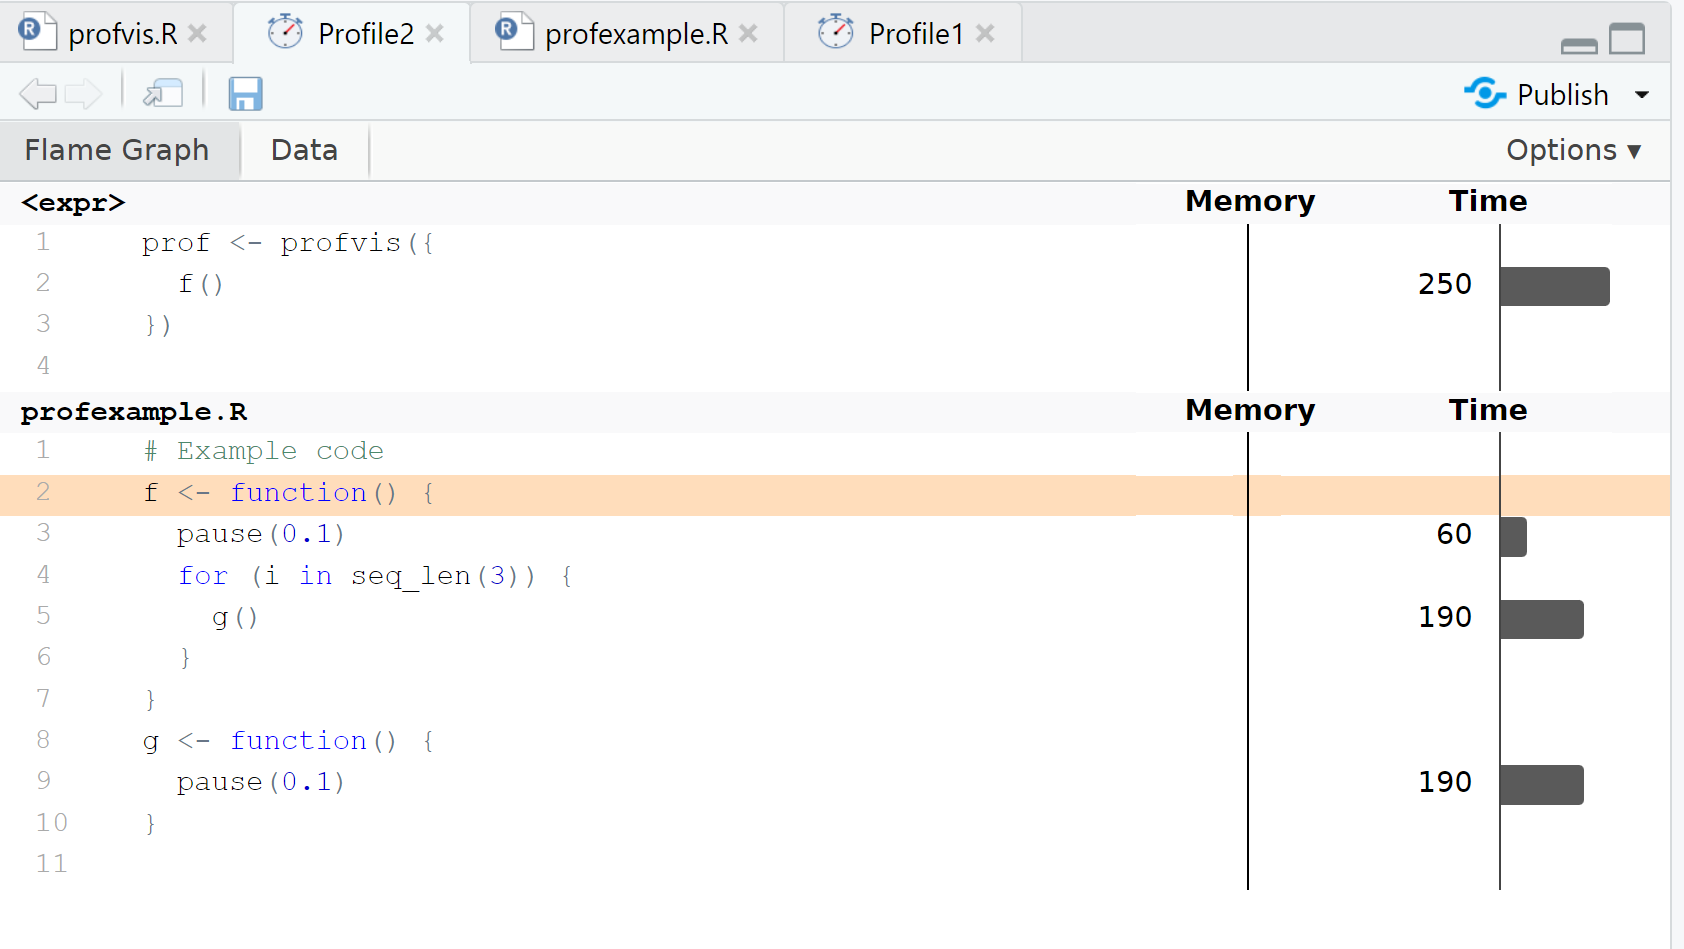
We can use the more modern profvis R package for visualizing where R spends its time during code execution.
Profiling: profvis output
Code optimization
Code optimization: Explore alternatives
- If the slow function is from another package, search for a faster one
- Runtime complexity (runtime as a function of data size) of different algorithms can be wildly different - some work well on small data but take forever on large data
- Few examples:
Code optimization: DRY on data frames
- Remember: DRY (Don’t Repeat Yourself)
- Data frames are expensive, i.e. take a lot of time.
- Some examples:
- Only create data frames, if really necessary.
- Bad:
if(nrow(filter(x, condition)) > 0) - Good:
if(any(condition))
- Bad:
- Assemble a data frame only once, not iteratively.
- When subsetting a data frame and working with a column, first extract the column and then subset.
- Only create data frames, if really necessary.
Code optimization: Reuse, don’t copy
Avoid making unintended copies of objects.
Other examples:
- Create a
data.frameonce from complete column vectors, rather thanrbind()it iteratively. - Subsetting a matrix or
data.framewill create a copy, so use it consciously or better work with columns.
Code optimization: Vectorize where possible
- Avoiding for loops does not help much anymore.
- However, using specialized vectorized functions (implemented in compiled code) helps:
- Base R:
rowSums(),colSums(),rowMeans(),colMeans() matrixStats: many!anyMissing(),colQuantiles(),rowMax(), etc.collapse:fmean(),TRA(),GRP(), …
- Base R:
Code optimization: Still too slow?
“R is a language optimized for human performance, not computer performance”
(Hadley Wickham, New York R Conference, 2018)
Code optimization: Shift to C++ with Rcpp
Writing and using C++ code in your R package is not easy.
But it is not too difficult with Rcpp by Eddelbuettel and François (2011).
- Starting point:
Rcpp::Rcpp.package.skeleton() - Use
RcppArmadillofor linear algebra - Hadley Wickham’s chapter Rewriting R code in C++
Note: Adding C++ code to your package will in many cases increase the maintenance effort significantly.
References
Exercise
- Read
bootstrap.Rand understand what is going on. - Run
profbootstrap.Rto see where most of the time is spent - where? - In a second version of the function,
impl_2, only update vectors inside the loop and then create atibbleonce at the end. - In a third version
impl_3only subset the column instead of the wholedata.frame. How much faster does it get? - In a fourth version
impl_4use thebootpackage. - Homework: Try to come up with a fifth version
impl_5that usesRcpp. Was it worth the effort?
License Information
- Creators (initial authors): Lukas A. Widmer and Michael Mayer, see their course Go fastR – how to make R code fast(er) and run it on high performance compute (HPC) clusters
- In the current version, changes were done by (later author): Daniel Sabanes Bove
- This work is licensed under the Creative Commons Attribution-ShareAlike 4.0 International License.
- The source files are hosted at github.com/RCONIS/workshop-r-swe-zrh, which is forked from the original version at github.com/openpharma/workshop-r-swe-mtl.
- Important: To use this work you must provide the name of the creators (initial authors), a link to the material, a link to the license, and indicate if changes were made