Cost distribution among software process activities
3 An R Package Engineering Workflow
Short Course: Good Software Engineering Practice for R Packages
Friedrich Pahlke
October 10, 2025
Motivation
From an idea to a production-grade R package
Example scenario: in your daily work, you notice that you need certain one-off scripts again and again.
The idea of creating an R package was born because you understood that “copy and paste” R scripts is inefficient, and on top of that, you want to share your helpful R functions with colleagues and the world…
Professional Workflow

Photo CC0 by ELEVATE on pexels.com
Typical work steps
- Idea
- Concept creation
- Validation planning
- Specification:
- User Requirements Spec (URS),
- Functional Spec (FS), and
- Software Design Spec (SDS)
- Test Plan (TP)
- R package programming
- Documented verification
- Completion of formal validation
- R package release
- Use in production
- Maintenance
Extensive documentation, huge paperwork, lots of manual work, lots of signatures, …
Workflow in Practice

Photo CC0 by Chevanon Photography on pexels.com
Frequently Used Workflow in Practice
- Idea
- R package programming
- Use in production
- Bug fixing
- Use in production
- Bug fixing + Documentation
- Use in production
- Bug fixing + Further development
- Use in production
- Bug fixing + …
Bad practice!
Why?
Why practice good engineering?

Why practice good engineering?
Origin of errors in system development

Boehm, B. (1981). Software Engineering Economics. Prentice Hall.
Why practice good engineering?
- Don’t waste time on maintenance
- Be faster with release on CRAN
- Don’t waste time with inefficient and buggy further development
- Fulfill regulatory requirements1
- Save refactoring time when the Proof-of-Concept (PoC) becomes the release version
- You don’t have to be shy any longer about inviting other developers to contribute to the package on GitHub
Why practice good engineering?
Invest time in
- requirements analysis,
- software design, and
- architecture…
… but in many cases the workflow must be workable for a single developer or a small team.
Workable Workflow
Photo CC0 by Kateryna Babaieva on pexels.com
Suggestion for a Workable Workflow
- Idea
- Design docs
- R package programming
- Quality check (see Ensuring Quality)
- Publication
- Use in production
Example - Step 1: Idea
Let’s assume that you used some lines of code to create simulated data in multiple projects:
Idea: put the code into a package
Example - Step 2: Design docs
- Describe the purpose and scope of the package
- Analyse and describe the requirements in clear and simple terms (“prose”)
| Obligation level | Key word1 | Description |
|---|---|---|
| Duty | must2 | “must have” |
| Desire | should | “nice to have” |
| Intention | may | “optional” |
Example - Step 2: Design docs
Purpose and Scope
The R package simulatr is intended to enable the creation of reproducible fake data.
Package Requirements
simulatr must provide a function to generate normal distributed random data for two independent groups. The function must allow flexible definition of sample size per group, mean per group, standard deviation per group. The reproducibility of the simulated data must be ensured via an optional seed. It should be possible to print the function result. The package may also facilitate graphical presentation of the simulated data.
Example - Step 2: Design docs
Useful formats / tools for design docs:
- R Markdown1 (*.Rmd)
- Quarto1 (*.qmd)
- Overleaf2
- draw.io3
UML Diagram
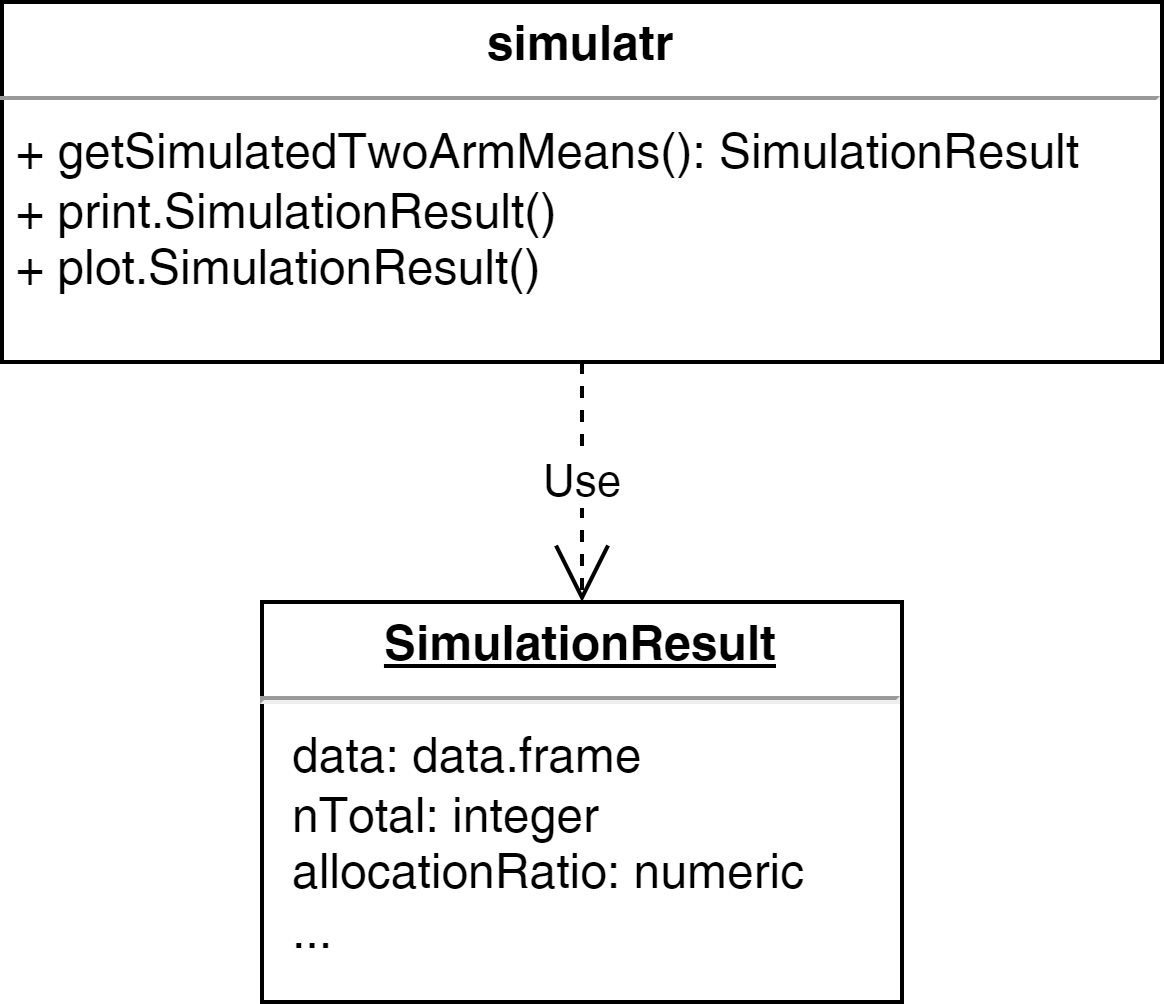
Example - Step 3: Packaging
R package programming
- Create basic package project (see R Packages)
- C&P existing R scripts (one-off scripts, prototype functions) and refactor1 it if necessary
- Create R generic functions
- Document all functions
Example - Step 3: Packaging
One-off script as starting point:
Example - Step 3: Packaging
Refactored script:
Almost all functions, arguments, and objects should be self-explanatory due to their names.
Example - Step 3: Packaging
Define that the result is a list1 which is defined as class2:
getSimulatedTwoArmMeans <- function(n1, n2, mean1, mean2, sd1, sd2) {
    result <- list(n1 = n1, n2 = n2,
         mean1 = mean1, mean2 = mean2, sd1 = sd1, sd2 = sd2)
    result$data <- data.frame(
        group = c(rep(1, n1), rep(2, n2)),
        values = c(
            rnorm(n = n1, mean = mean1, sd = sd1),
            rnorm(n = n2, mean = mean2, sd = sd2)
        )
    )
    # set the class attribute
    result <- structure(result, class = "SimulationResult")
    return(result)
}Example - Step 3: Packaging
The output is impractical, e.g., we need to scroll down:
$n1
[1] 50

$n2
[1] 50

$mean1
[1] 5

$mean2
[1] 7

$sd1
[1] 3

$sd2
[1] 4

$data
    group     values
1       1  1.3425480
2       1  3.3537258
3       1  8.2458348
4       1 10.0857173
5       1  9.5828267
6       1  5.3488739
7       1  4.3116028
8       1  0.7503367
9       1  5.2631969
10      1  1.1792281
11      1  7.2846426
12      1  6.1192099
13      1  4.9353445
14      1  3.7500700
15      1  6.1911366
16      1  3.3073038
17      1  4.0445815
18      1  3.9361709
19      1  5.5739762
20      1  6.2543383
21      1  5.6808816
22      1  8.1247087
23      1  4.8668120
24      1 10.1017219
25      1  6.6319799
26      1  2.7546205
27      1  4.4989323
28      1  3.3015368
29      1  8.4875055
30      1  3.9379411
31      1  2.7901855
32      1  3.6010634
33      1  9.2778918
34      1  8.1183440
35      1  2.3263521
36      1  4.3096121
37      1  4.6822419
38      1  8.0885011
39      1  2.7511550
40      1 10.2684148
41      1  3.2551111
42      1  3.2778476
43      1  5.6532560
44      1  4.7202636
45      1  6.1329442
46      1  7.6769767
47      1  5.7107966
48      1  4.1861767
49      1  4.4996527
50      1  7.0061488
51      2  6.3800038
52      2  4.4444490
53      2 11.2320416
54      2 11.6386296
55      2  2.7777384
56      2  2.1304277
57      2 10.0008823
58      2  2.5336071
59      2  7.1073463
60      2 11.5493454
61      2  2.1437719
62      2  7.3691466
63      2 12.8449045
64      2  4.5152416
65      2  2.7897471
66      2  7.1425983
67      2  6.5560708
68      2 11.6968559
69      2  7.9931436
70      2  4.6467151
71      2 11.1405132
72      2 10.0627624
73      2  4.2703805
74      2 10.2107799
75      2  7.3463475
76      2  5.8604736
77      2  6.7574597
78      2  4.8799859
79      2  3.8871577
80      2  6.9743927
81      2  8.4536808
82      2  2.7814186
83      2  2.1932568
84      2  5.1142248
85      2 16.7872833
86      2  6.9093539
87      2  1.6572324
88      2  4.6730631
89      2  7.3959313
90      2  3.3779958
91      2  8.4148407
92      2  6.1893899
93      2  4.5397871
94      2  6.5759462
95      2  0.5533427
96      2  6.3715799
97      2  8.0827249
98      2  2.6759592
99      2  4.6203728
100     2  4.1833054

attr(,"class")
[1] "SimulationResult"
Solution: implement generic function print
Example - Step 3: Packaging
Generic function print:
#' @title
#' Print Simulation Result
#'
#' @description
#' Generic function to print a `SimulationResult` object.
#'
#' @param x a \code{SimulationResult} object to print.
#' @param ... further arguments passed to or from other methods.
#'
#' @examples
#' x <- getSimulatedTwoArmMeans(n1 = 50, n2 = 50, mean1 = 5,
#'      mean2 = 7, sd1 = 3, sd2 = 4, seed = 123)
#' print(x)
#'
#' @export
$args
n1 n2 mean1 mean2 sd1 sd2
"50" "50" "5" "7" "3" "4"
$data
# A tibble: 100 × 2
group values
<dbl> <dbl>
1 1 1.34
2 1 3.35
3 1 8.25
4 1 10.1
5 1 9.58
6 1 5.35
7 1 4.31
8 1 0.750
9 1 5.26
10 1 1.18
# ℹ 90 more rowsExercise

Photo CC0 by Pixabay on pexels.com
Preparation
- Download the unfinished R package simulatr
- Extract the package zip file
- Open the project with RStudio
- Complete the tasks below
Tasks
Add assertions to improve the usability and user experience
Tip on assertions
Use the package checkmate to validate input arguments.
Example:
Error in playWithAssertions(-1) : Assertion on ‘n1’ failed: Element 1 is not >= 1.
Add three additional results:
- n total,
- creation time, and
- allocation ratio
Tip on creation time
Sys.time(), format(Sys.time(), '%B %d, %Y'), Sys.Date()
Add an additional result: t.test result
Add an optional alternative argument and pass it through t.test:
Implement the generic functions print and plot.
Tip on print
Use the plot example function from above and extend it.
Optional extra tasks:
Implement the generic functions
summaryandcatImplement the function
kableknown from the package knitr as generic. Tip: useto define kable as generic
Optional extra task1:
Document your functions with Roxygen2
- If you are already familiar with Roxygen2
References
- Gillespie, C., & Lovelace, R. (2017). Efficient R Programming: A Practical Guide to Smarter Programming. O’Reilly UK Ltd. [Book | Online]
- Grolemund, G. (2014). Hands-On Programming with R: Write Your Own Functions and Simulations (1. Aufl.).
O’Reilly and Associates. [Book | Online] - Rupp, C., & SOPHISTen, die. (2009). Requirements-Engineering und -Management: Professionelle, iterative Anforderungsanalyse für die Praxis (5. Ed.). Carl Hanser Verlag GmbH & Co. KG. [Book]
- Wickham, H. (2015). R Packages: Organize, Test, Document, and Share Your Code (1. Aufl.). O’Reilly and Associates. [Book | Online]
- Wickham, H. (2019). Advanced R, Second Edition.
Taylor & Francis Ltd. [Book | Online]
License information
- Creators (initial authors): Friedrich Pahlke
- In the current version, changes were done by (later authors): Andrew Bean
- This work is licensed under the Creative Commons Attribution-ShareAlike 4.0 International License.
- The source files are hosted at github.com/RCONIS/SnB2025-shortcourse, which is forked from and a subset of the original version at github.com/RCONIS/user2024-tutorial-gswep.
- Important: To use this work you must provide the creators’ names, links to the material and license, and indicate if changes were made.